The Flood Zones Mapping of the Segura Hydrographic Demarcation began, covering a total of 1,285 km of riverbeds, including those corresponding to the ARPSI, with the forecast of expanding in subsequent cycles, with which currently There are already 1,487 km of riverbed sections with a study of its flood zones. This cartography has been incorporated into the National Floodplaces Cartography System (SNCZI), and can be viewed in the SNCZI Floodplaces cartographic viewer .
This cartography includes the flooded areas associated with avenues 5, 10, 25 (only in the scope of the Generalitat Valenciana), 50, 100 and 500 years of return period, as well as the corresponding drafts for the return periods of 10 , 100 and 500. Also the delimitation of the public hydraulic domain of the sections associated with said flood zones (demarcated DPH and cartographic DPH estimated as probable) and their easement and police zones, as well as the preferential flow zone.
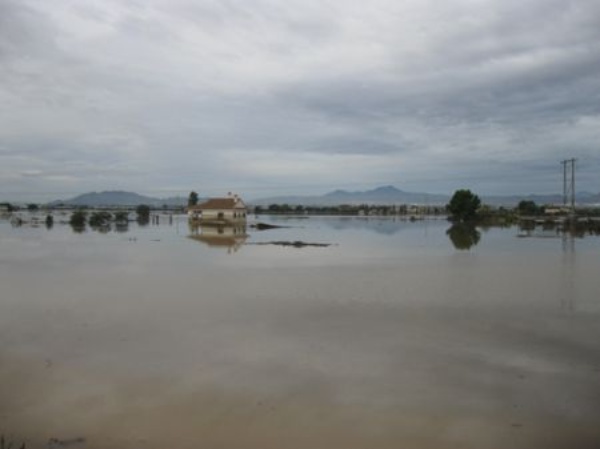
Valle del Guadalentín. Riada de San Wenceslao. 28/09/2012 (Lorca. Murcia)
It should be noted that the flooded areas obtained have important limitations in terms of their coincidence with the representation of the real flood that would occur in a specific event. Current techniques, although very precise, have important limitations that mean that the actual flooding of an event can vary significantly from what was calculated. Some of these LIMITATIONS stand out:
- The effects of erosions, landslides, sedimentations, etc. are not considered in the hydraulic study, and are only taken into account through geomorphological criteria in the delimitation of the preferential flow zone. In some cases, especially in sections of steep slopes, the geomorphological changes can be very important and the results may differ significantly from what was expected.
- The hydraulic simulation carried out cannot foresee the effects that certain elements (fallen trees, vehicles, etc.) can produce through obstructions or diversions of the flow.
- In large and heavily anthropized floodplains, the difficulties to adequately represent in the model all the artificial elements that influence the flow characteristics, and the computational limitations of the hydraulic model in view of the enormous amount of data to be processed, can also make that the actual flood results differ from the model predictions.
- In the elaboration of the maps, the effect of direct rain on a surface already affected by a flood coming from upstream is not considered.
ACCESS TO THE CARTOGRAPHIC VIEWERS