Rainfall Spatial Distribution
Next you will find some Rainfall Spatial Distribution graphs elaborated from information obtained by the net of sensors of the SAIH system.
Hourly Rainfall Report
In this section you will find the Hourly Rainfall Report (in milimeters) elaborated from information obtained by the net of sensors of the SAIH system.
Daily Rainfall Report
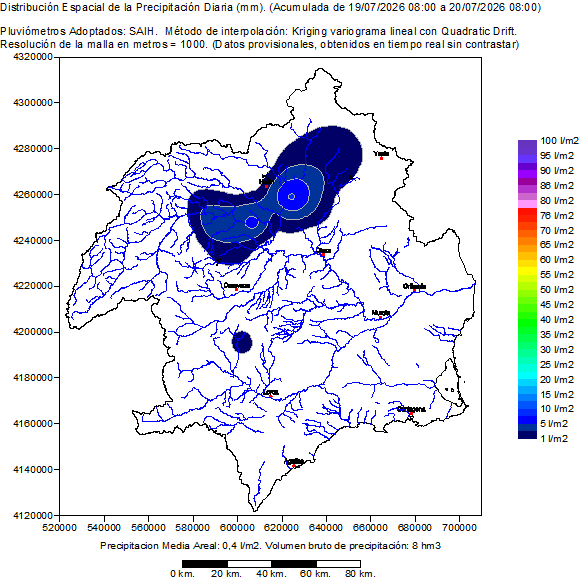
It contains the spatial distribution of the rainfalls registered by the pluviometers SAIH in the hydrological day selected (of 08:00 to 08:00 of the following day). Also it shows a map of the basin with the location of the pluviometers SAIH and the value of his rainfall accumulated in the hydrological day. Finally presents a table with the list of the rainfall in every pluviometer SAIH distributed per hours in the hydrological selected day.
Monthly Rainfall Report
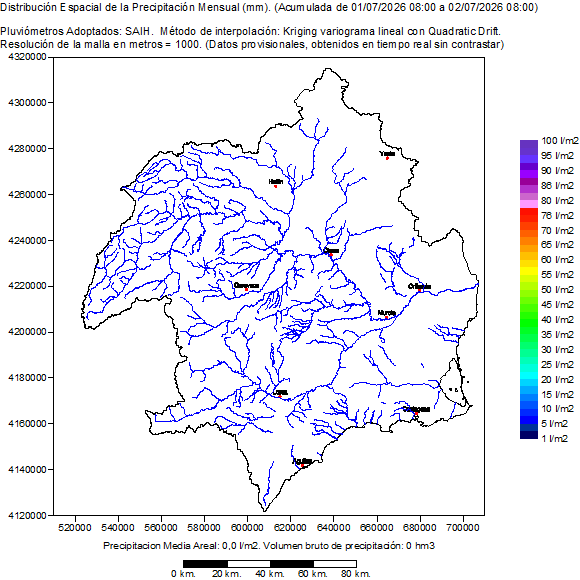
It contains the spatial distribution of the rainfalls registered by the pluviometers SAIH in the selected month. Also it shows a map of the basin with the location of the pluviometers SAIH and the value of his rainfall accumulated in the month. Finally presents a table with the list of the rainfall in every pluviometer SAIH distributed per days in the month.
- Monthly rainfall report (7-2026) (807.83 KB)
Annual Rainfall Report
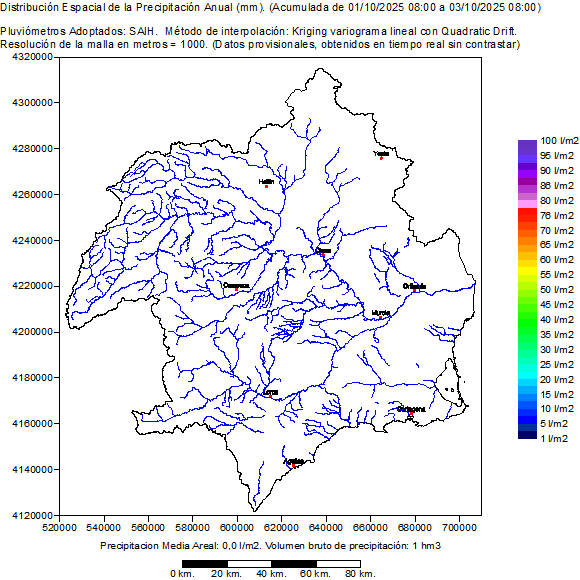
It contains the spatial distribution of the rainfalls registered by the pluviometers SAIH in the hydrological selected Year. Also it shows a map of the basin with the location of the pluviometers SAIH and the value of his rainfall accumulated in the hydrological year. Finally he presents a table with the list of the rainfall in every pluviometer SAIH distributed per months in the hydrological year.
- Annual rainfall report (2026) (644.34 KB)